May 2020 was another interesting month (I'm still hesitant to call this the new norm) where Merch sales began to trickle back in, but overall sales remained slow.
Sales: 1,337
Revenue: $27,050.85
Profit: $5,986.69
Gross Margin: 22%
2020 💰 Profit to Date: $31,068.32
 * sales data from JungleScout Sales Alaytics
It was a tough month for my FBA business... my primary brand is sold mainly to businesses that operate retail locations.
As you probably know, many of them remained closed throughout May, across the United States/

* click to expand
I had a 3-way tie for "best selling SKU" of the month (not bad)
One big problem that I had was that while Amazon lifted the restriction on FBA inbound shipments for non-essential items...
My supplier was out of raw material to produce my new order!
This is supply-chain breakdown in a true sense. The raw material used to build the end product that we're used to seeing on shelves in stores & stocked on Amazon is currently in such high demand that my supplier couldn't get enough to produce the majority of my order.
This will negatively impact my future sales of this product...
And here's my Campaign Manager statistics from Seller Central:

- Spend: $337.26 $26.43 MoM
- Sales: $856.06 $526.09 MoM
- ACoS: 39.40% 13.09% MoM
If you're ready to start your FBA business, you can enroll below:

I show you exactly how I built my FBA business from the ground up, & how I run it today - nothing is held back.
Sales: 97
Revenue: $1,814.90
Royalty: $327.62
Avg. Royalty: $3.38
2020 💰 Profit to Date: $2,974.22
 USA
USA
$284.94 UK
UK
£22.99 DE
DE
€12.63
 * sales data from PrettyMerch Pro
I was STOKED that Amazon Merch reopened... but unfortunately, they're being very slow to reactivate existing listings.
According to PrettyMerch, currently only 1,116 of my 18,488 "live" products are buyable by customers.
As a result, my Merch sales were low... but they were greater than 0, so it's a step in the right direction!
Here's my sales breakdown by day:

* click to expand
Breakdown by product type:

* click to expand
Breakdown by fit type:

* click to expand
And last, breakdown by color:

* click to expand
Uploads Update
18,488 / 20,000

I've filled 92% of my upload slots which is fortunate as uploading is still paused.
If you're ready to take your Amazon Merch business to the next level, you can enroll in Ryan's Method: Amazon Merch Course below:

I show you every trick in the book that I used to reach tier 10,000, including niche research tips, design tips, listing optimization tips, AMS advertising tips, & automation tips in the bonus section!
Sales: 404
Profit: $2,080.61
2020 💰 Profit to Date: $10,087.66
- Amazon.com
305 - Amazon.co.uk
25 - eBay
2 - Etsy
0 - Redbubble
138 - Spreadshirt
3 - Teepublic
89 - Teespring
0 - Zazzle
4
My print on demand sales remained strong, and my Amazon.co.uk sales dropped a bit month-over-month but remained strong when you look at the long-term trend.
I also benefited from a 5% volume discount on all of my Printful sales.
Join Printful today »
Right now is still a great time to take advantage of the Printful + Amazon Seller Central integration if you haven't already.
While publishing is still frozen on Amazon Merch, you can capitalize on trending t-shirt designs by offering them through Printful.
Here's my Printful sales chart for my Amazon (.com) Seller Central account:
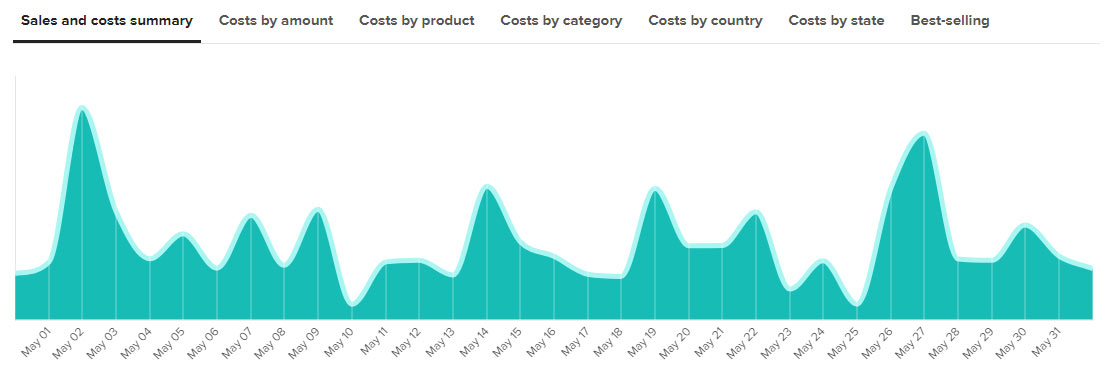
* click to expand
And here's my Printful sales chart for my Amazon (.co.uk) Seller Central account:

* click to expand
Here's a breakdown of my profit from my top 4 platforms:
- Amazon (.com): $1,246.43
- Redbubble: $389.53
- Amazon (.co.uk): $259.38
- Teepublic: $160.25
I'm loving Teepublic... it's very easy to upload to the platform, and sales come organically. Unlike Teespring where us, the creator, are expected to drive traffic, Teepublic does a great job of bringing customers to their website & getting our products out in front of them.
Selling on Redbubble is also a must if you're not already.
Enrollment in Ryan's Method: Dropshipped Print on Demand is OPEN!

In it, I walk you through setting up your Amazon Seller Central account & integrating it with Printful + opening an optimized Etsy shop & cover selling on ~7 other platforms, to maximize coverage & get the highest return on investment from each print on demand design you create.
Sales: 62
Profit: $116.81
Avg. Royalty: $1.88
2020 💰 Profit to Date: $1,164.50

$116.81 of profit was generated on 62 sales @ an average royalty of $1.88 per paperback book.
I took the "lazy" / "autopilot" approach to uploading new books to KDP on the month, due to time restrictions.
I am working on optimizing a workflow that will allow me to publish high-quantities of (high quality), unique puzzle books to KDP in the future.
Check out my recent YouTube video where I walk you through how to generate KDP Sudoku puzzles using PuzzleWiz (from the makers of BookBolt).
The entire process takes a minute or two... and if you're using the Merch Titans KDP Automation uploader, it's very minimal effort!
Profit breakdown by market:

* click to expand
Here's a breakdown of my profits by Amazon marketplace:
- United States: $92.47
- United Kingdom: $14.59
- Germany: $3.78
- France: $2.07
- Italy: $2.02
- Spain: $1.89
Sales breakdown by day for May:

* click to expand
Sales breakdown by market:

* click to expand
If you'd like me to show you how I went from $0 to exceed $3,000+ profit selling low-content books on Amazon, you're in luck.
Enrollment in Ryan's Method: Amazon KDP is OPEN!

By selling "low content" books, we avoid spending time writing the content for book interiors & instead focus on selling notebook-style paperback books to various niche markets. Trust me - it works!
Google Ads
Earnings (Total): $1,491.55
YouTube: $1,058.32
Website: $433.23
Page Views: 1,157,985
Ad Impressions: 2,188,865
2020 💰 Profit to Date: $4,948.85
 * data from Google Ads
I run a few popular websites where I collect advertising revenue via Google Ads (formerly Google AdSense). I also collect revenue via direct partnerships with advertisers & from affiliate links, but for times sake, I'm going to omit those deals.
I won't be doing month-to-month write ups here because I don't spend much time maintaining these websites. They started out as passion projects that allowed me to become a better web developer, but today I spend very little time working on them.
Here's a glimpse into my Google Analytics for my website:
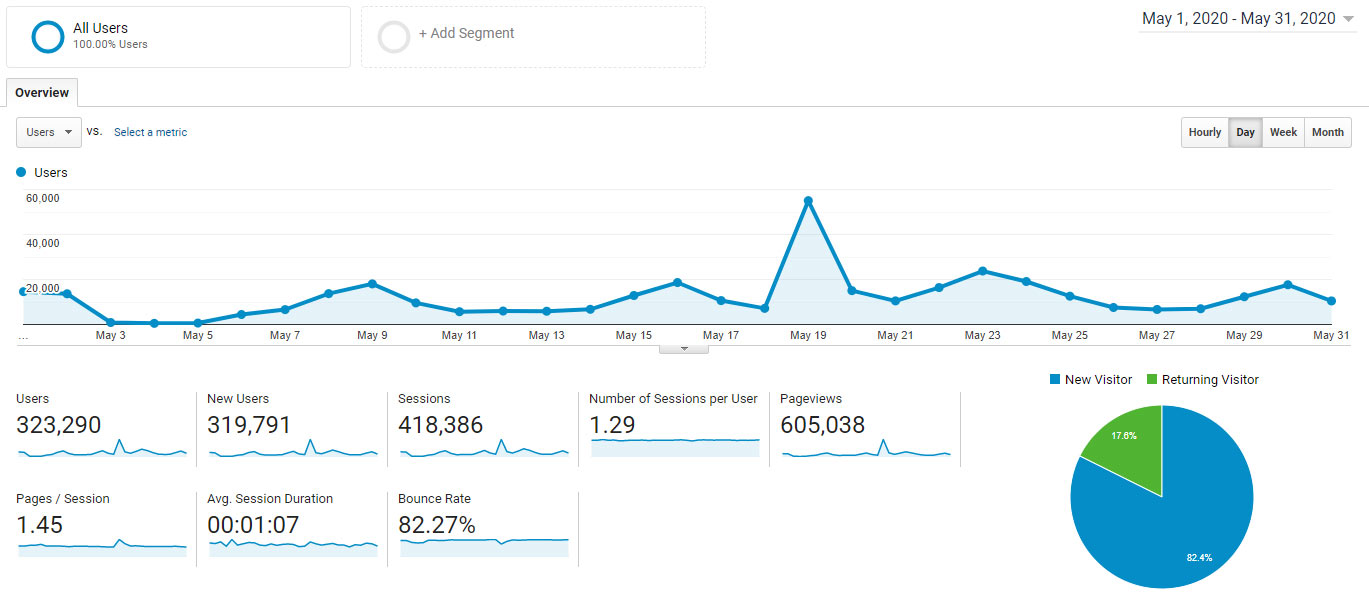
* click to expand
YouTube Revenue
My YouTube channel (Ryan Hogue Passive Income) monetizes most videos that get posted.
As a result, I see a bit of additional income each month from Google running video (AdSense) ads.
Earnings: $1,058.32
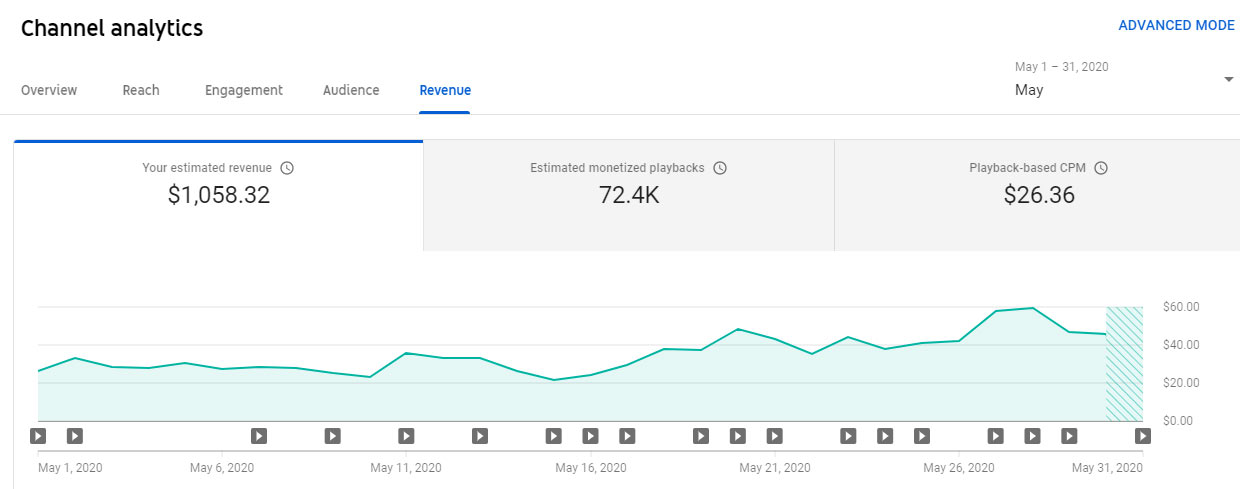
* click to expand
Subscribers: 3,400
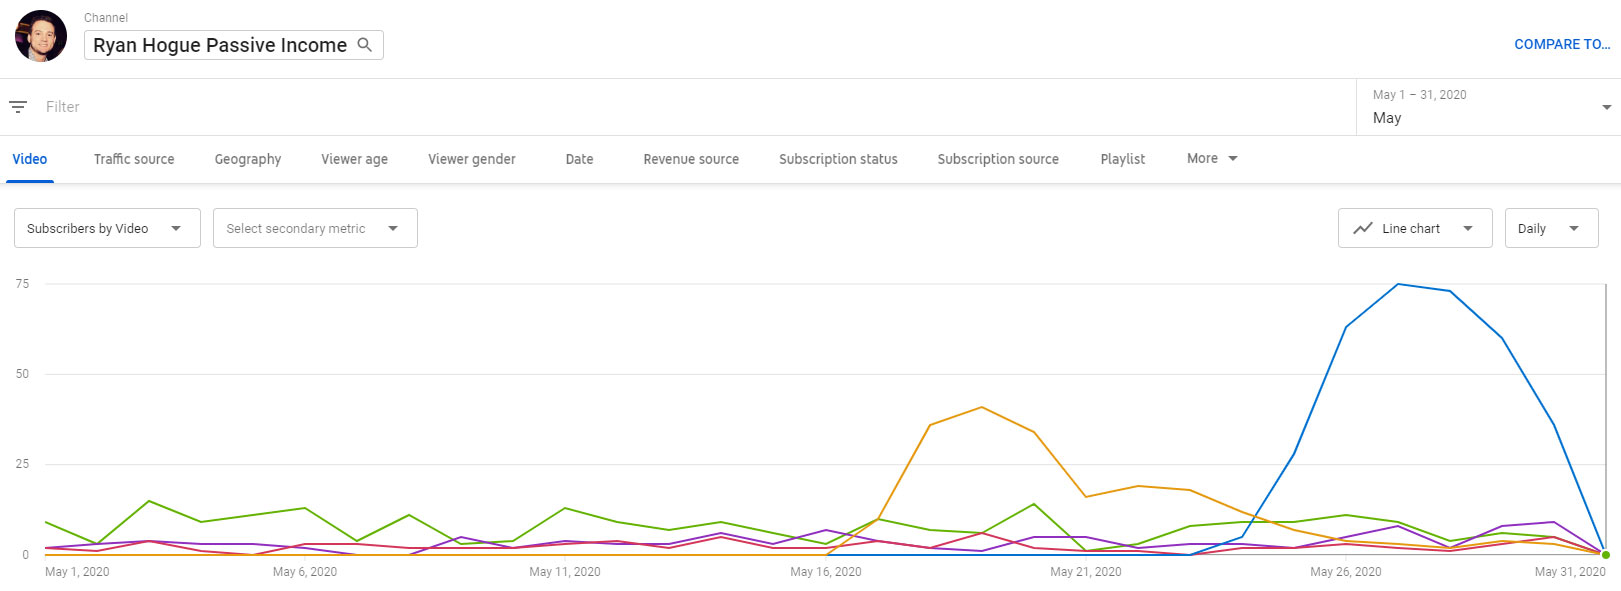
* click to expand
If you haven't already, click the link below & subscribe to receive updates when I post new content!

 * sales data from JungleScout Sales Alaytics


 USA
USA UK
UK DE
DE


