Sales: 2,478
Revenue: $47,036.89
Profit: $12,110.63
Gross Margin: 25%
2020 💰 Profit to Date: $43,178.95
 * sales data from JungleScout Sales Alaytics
This was a big month for my FBA business.
Nothing particularly crazy happened, but I still had a killer month with 5-figure profits.

* click to expand
Not to mention... my #3 best seller from May (#1 best seller in April) was SOLD OUT!
Meaning, I didn't have any sales contributions from those products!
(Not bad)
And here's my Campaign Manager statistics from Seller Central:

- Spend: $471.55 $134.29 MoM
- Sales: $4,960.03 $4,103.94 MoM
- ACoS: 9.51% 29.89% MoM
If you're ready to start your FBA business, you can enroll below:

I show you exactly how I built my FBA business from the ground up, & how I run it today - nothing is held back.
Sales: 108
Revenue: $1,938.80
Royalty: $350.99
Avg. Royalty: $3.25
2020 💰 Profit to Date: $3,325.21
 USA
USA
$292.40 UK
UK
£32.38 DE
DE
€16.13
 * sales data from PrettyMerch Pro
For the majority of the month of June, only about 11% of my listings were live.
As we inched closer to July, I noticed more and more of my %listings "buyable" (a feature made possible by PrettyMerch were available each day!
I suspected that meant publishing may resume for US markets sooner than later... and I was excited that:
On July 1st, publishing resumed to the US market!
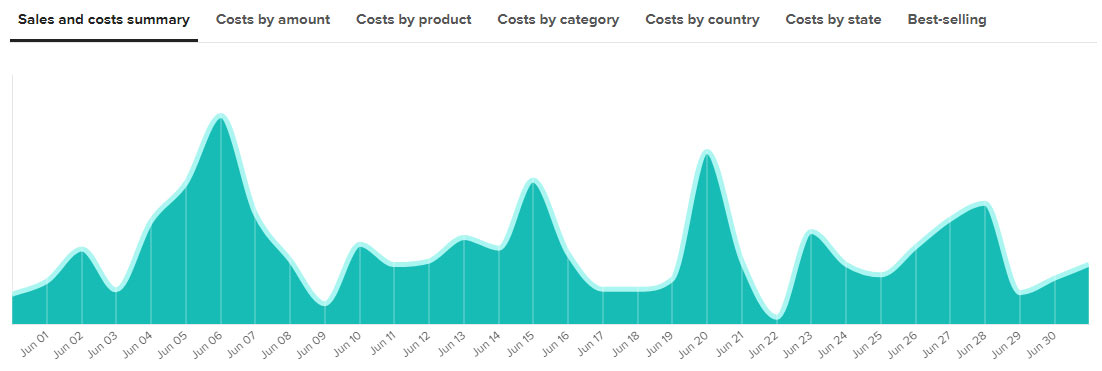
Here's my sales breakdown by day:

* click to expand
Breakdown by product type:

* click to expand
Breakdown by fit type:

* click to expand
And last, breakdown by color:

* click to expand
Uploads Update
18,488 / 20,000

If you're ready to take your Amazon Merch business to the next level, you can enroll in Ryan's Method: Amazon Merch Course below:
I show you every trick in the book that I used to reach tier 10,000, including niche research tips, design tips, listing optimization tips, AMS advertising tips, & automation tips in the bonus section!
Sales: 464
Profit: $2,257.26
2020 💰 Profit to Date: $12,344.92
- Amazon.com
238 - Amazon.co.uk
19 - eBay
2 - Etsy
0 - Redbubble
155 - Spreadshirt
6 - Teepublic
39 - Teespring
0 - Zazzle
4 - Bonanza
1
I didn't have any big trending designs, everythign was relatively evergreen that sold in June.
As far as issues with production time:
The hats that I sold through Printful were getting sent out in 5-6 days on average.
And I used Shirtly to fulfill t-shirts, which were sent out in about 4 days on average.

Here's my Printful sales chart for my Amazon (.com) Seller Central account (Gearbubble sales no pictured):
* click to expand
Here's my Printful sales chart for my Amazon EU (.co.uk) Seller Central account:
* click to expand
My EU sales came back down to Earth over the past few months, after a huge month in April.
Here's a breakdown of my profit from my top 4 platforms:
- Amazon (.com): $1,486.39
- Redbubble: $405.57
- Amazon (.co.uk): $178.05
- Teepublic: $123.00
As Teepublic is owned by Redbubble, it makes sense that they've seen somewhat of an uptick in sales.
Last, my efforts were rewarded with a Printful volume discount of 7%!
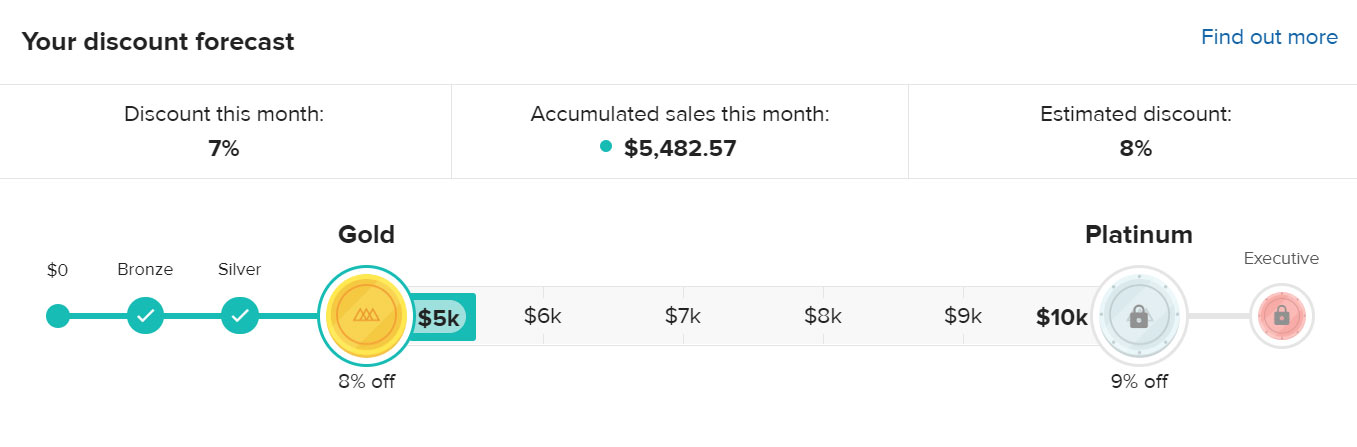
* click to expand
(Next month I will try to remember to get a picture of the dashboard with my current aggregate sales level before it resets on the 1st of the following month!)
Enrollment in Ryan's Method: Dropshipped Print on Demand is OPEN!
In it, I walk you through setting up your Amazon Seller Central account & integrating it with Printful + opening an optimized Etsy shop & cover selling on ~7 other platforms, to maximize coverage & get the highest return on investment from each print on demand design you create.
Sales: 50
Profit: $90.25
Avg. Royalty: $1.81
2020 💰 Profit to Date: $1,254.75

$90.25 of profit was generated on 50 sales @ an average royalty of $1.81 per paperback book.
I focused on publishing puzzle books in the month of June, including:
Profit breakdown by market:

* click to expand
Here's a breakdown of my profits by Amazon marketplace:
- United States: $44.44
- United Kingdom: $32.67
- Canada: $9.24
- Spain: $1.96
- France: $1.94
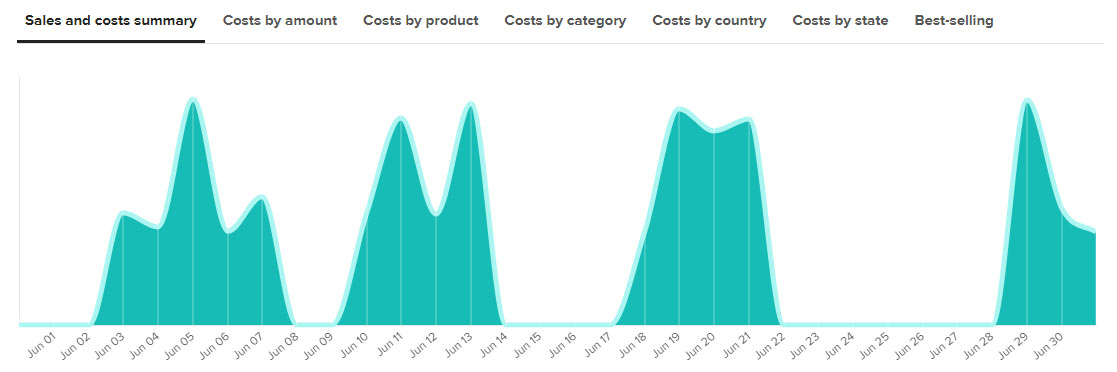
Sales breakdown by day for June:

* click to expand
Sales breakdown by market:

* click to expand
As usualy, the US market lead the way, followed by the UK market.
If you'd like me to show you how I went from $0 to exceed $3,000+ profit selling low-content books on Amazon, you're in luck.
Enrollment in Ryan's Method: Amazon KDP is OPEN!
By selling "low content" books, we avoid spending time writing the content for book interiors & instead focus on selling notebook-style paperback books to various niche markets. Trust me - it works!
Google Ads
Earnings (Total): $3,614.38
YouTube: $3,341.65
Website: $272.73
Page Views: 1,596,385
Ad Impressions: 2,046,698
2020 💰 Profit to Date: $7,455.97
 * data from Google Ads
I run a few popular websites where I collect advertising revenue via Google Ads (formerly Google AdSense). I also collect revenue via direct partnerships with advertisers & from affiliate links, but for times sake, I'm going to omit those deals.
I won't be doing month-to-month write ups here because I don't spend much time maintaining these websites. They started out as passion projects that allowed me to become a better web developer, but today I spend very little time working on them.
Here's a glimpse into my Google Analytics for my website:
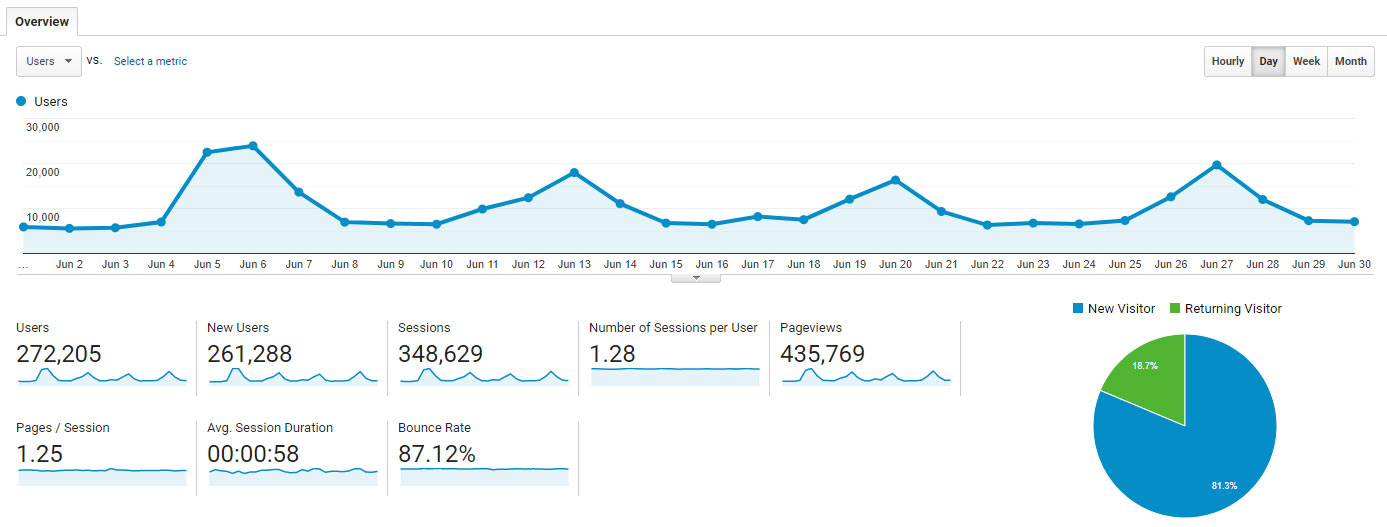
* click to expand
YouTube Revenue
My YouTube channel (Ryan Hogue Passive Income) monetizes most videos that get posted.
As a result, I see a bit of additional income each month from Google running video (AdSense) ads.
Earnings: $3,341.65
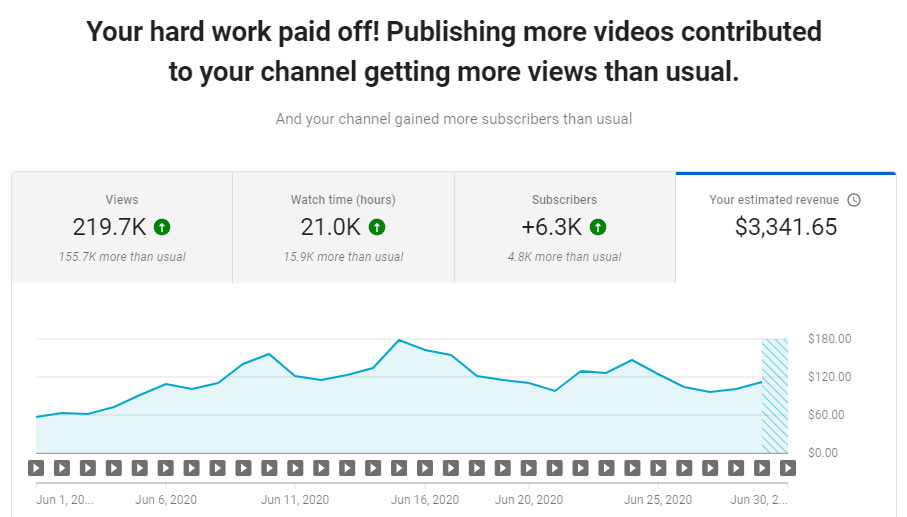
* click to expand
Subscribers: +6,300
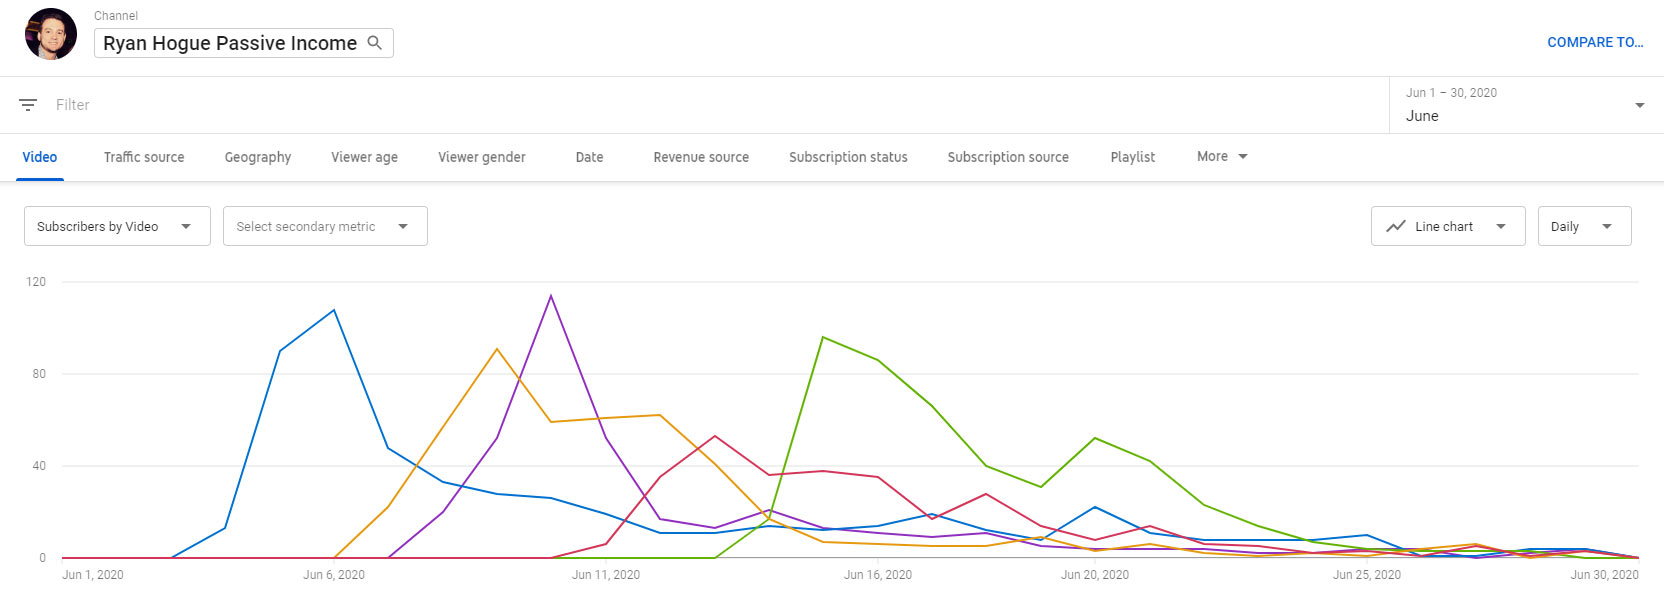
* click to expand
If you haven't already, click the link below & subscribe to receive updates when I post new content!