Lets break down why my July Amazon FBA & Amazon Merch sales picked up, and my dropshipped print on demand sales fell slightly compared to June, and KDP help steady.
Sales: 1,722
Revenue: $42,646.58
Profit: $8,454.70
Gross Margin: 19%
2020 💰 Profit to Date: $51,633.65
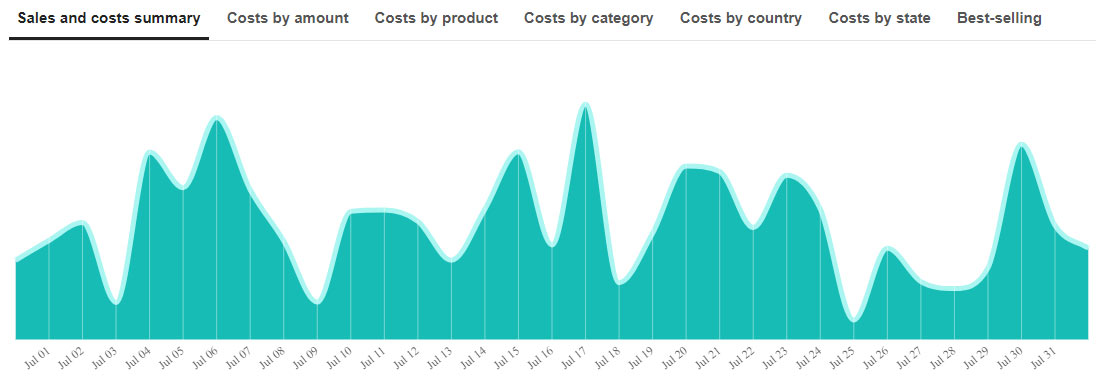
 * sales data from JungleScout Sales Alaytics
I was sold out of multiple best selling products in July, unfortunately.
Some due to increased demand, others due to supply chain issues.
One interesting note: intake of products that arrived at FBA warehouses reminded me of Q4/Holiday times.
Just yesterday, I had a shipment of one SKU arrive at the Amazon warehouse. The "Available by" date was 9 days out into the future (10 if you include the fact that they arrived in the morning yesterday).
My guess is that they're being inundated with fresh shipments of re-orders of products, as the world turns to the internet to purchase more and more goods.

* click to expand
Month-over-month you'll notice the difference in my "most profitable skus" graph as a result of my inventory issues.
The most unfortunate one was the supply-chain issue... as I would've definitely been able to move a lot of units had they been able to fulfill the full order.
And here's my Campaign Manager statistics from Seller Central:

- Spend: $726.82 $255.27 MoM
- Sales: $5,164.75 $204.72 MoM
- ACoS: 14.07% 4.56% MoM
If you're ready to start your FBA business, you can enroll below:

I show you exactly how I built my FBA business from the ground up, & how I run it today - nothing is held back.
Sales: 297
Revenue: $5,347.36
Royalty: $948.72
Avg. Royalty: $3.19
2020 💰 Profit to Date: $4,273.93
 USA
USA
$918.64 UK
UK
£15.76 DE
DE
€8.03
 * sales data from PrettyMerch Pro
My Amazon Merch sales finally picked back up to normal levels pre-pandemic!
It feels awesome to see consistent sales once again. I even almost considered re-enabling the "Cha-ching!" noise =)
Oh yeah, and on July 30th I was (finally) granted access to selling phone cases!

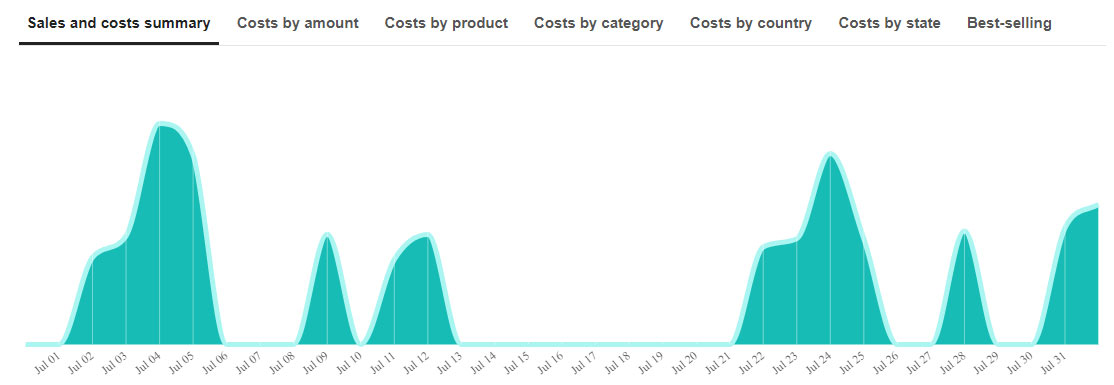
Here's my sales breakdown by day:

* click to expand
Breakdown by product type:

* click to expand
Breakdown by fit type:

* click to expand
And last, breakdown by color:

* click to expand
Uploads Update
My buyable products has been consistently hovering around 99% (18,476/18,536) or higher for the past few weeks, which has no-doubt helped increased my sales.
18,536 / 20,000

I cracked the 15,000 mark and have 5,000 uploads to go before maxing out my 20,000 upload slots.
If you're ready to take your Amazon Merch business to the next level, you can enroll in Ryan's Method: Amazon Merch Course below:
I show you every trick in the book that I used to reach tier 10,000, including niche research tips, design tips, listing optimization tips, AMS advertising tips, & automation tips in the bonus section!
Sales: 405
Profit: $1,910.78
2020 💰 Profit to Date: $14,255.70
- Amazon.com
208 - Amazon.co.uk
16 - eBay
2 - Redbubble
153 - Spreadshirt
6 - Teepublic
15 - Teespring
0 - Zazzle
5
My dropshipped print on demand sales fell month-over-month.
I want to attribute it to a lower demand for my products. For whatever reason, lots of people were buying in June... and not as much in July.
I also had to delete some semi-trending products from Amazon because I had seen them get removed from Redbubble and/or Teepublic (I consider this the "canary in a coal mine").
Protecting my Seller Central account is a top priority of mine
Here's my Printful sales chart for my Amazon (.com) Seller Central account (Gearbubble sales no pictured):
* click to expand
Here's my Printful sales chart for my Amazon EU (.co.uk) Seller Central account:
* click to expand
April was a huge month this year for my .co.uk account's POD sales, unfortunately I haven't been able to reproduce that level of success since (Q4 maybe?).
Here's a breakdown of my profit from my top 4 platforms:
- Amazon (.com): $1,249.12
- Redbubble: $398.61
- Amazon (.co.uk): $143.64
- Teepublic: $76.50
Every extra dollar from POD sales on a "Tier 3" market helps! And with Q4 quietly approaching, it's more important now than ever to be uploading to as many marketplaces as possible.
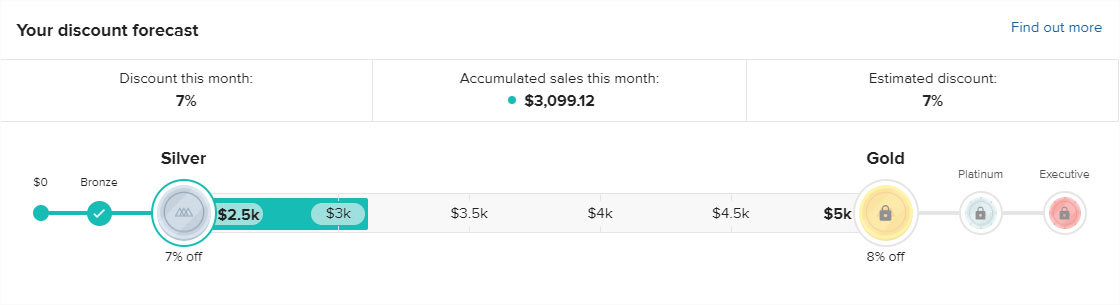
Last, my efforts were rewarded with a Printful volume discount of 7%!
* click to expand
This means that in August, the base-cost of my Printful-fulfilled products will be reduced by 7%,
Enrollment in Ryan's Method: Dropshipped Print on Demand is OPEN!
In it, I walk you through setting up your Amazon Seller Central account & integrating it with Printful + opening an optimized Etsy shop & cover selling on ~7 other platforms, to maximize coverage & get the highest return on investment from each print on demand design you create.
Sales: 40
Profit: $74.38
Avg. Royalty: $1.86
2020 💰 Profit to Date: $1,329.13

$74.38 of profit was generated on 40 sales @ an average royalty of $1.86 per paperback book.
My KDP sales were OK on the month, but I am not deterred by a slow July.
Regardless of my sales in the middle of the year, I'm eyeing a huge Q4 (hopefully), which motivates me to upload no less than 500 books per week.
You read that right.
I'm only uploading 500 books per week because I am worried about "pushing the limit" as far as weekly upload limits go, and I'd rather play it safe than potentially put my account at risk.
(I've gotten two automated violation warnings about exceeding the 1,000 books/mo limit... even though on the second time, I absolutely didn't hit the 1,000 mark.
Profit breakdown by market:

* click to expand
Here's a breakdown of my profits by Amazon marketplace:
- United States: $43.24
- United Kingdom: $21.15
- Germany: $6.33
- Canada: $3.66
Sales breakdown by day for July:

* click to expand
Sales breakdown by market:

* click to expand
Amazon KDP is an incredibly good opportunity to list print on demand books for sale to a global audience, on a trusted website.
It's especially true if you've got print on demand designs already created, as you can convert them into KDP book covers with ease using a [FREE] tool that I share in my course.
If you'd like me to show you how I went from $0 to exceed $3,500+ profit selling low-content books on Amazon, you're in luck.
Enrollment in Ryan's Method: Amazon KDP is OPEN!
By selling "low content" books, we avoid spending time writing the content for book interiors & instead focus on selling notebook-style paperback books to various niche markets. Trust me - it works!
Google Ads
Earnings (Total): $3,959.01
YouTube: $3,686.75
Website: $272.26
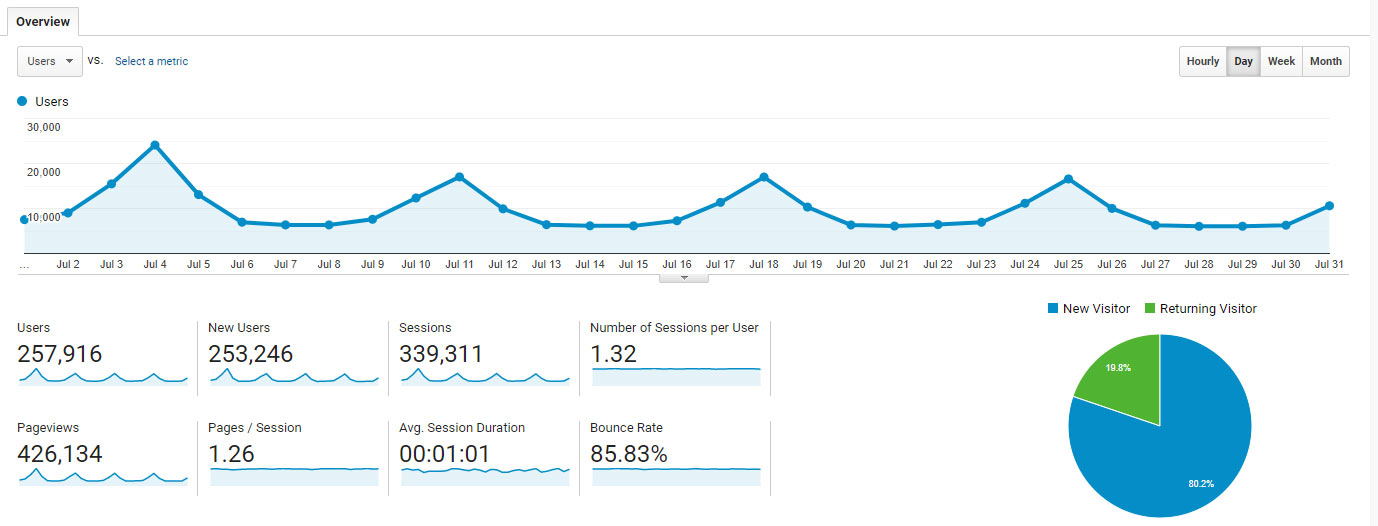
Page Views: 2,414,906
Ad Impressions: 2,368,485
2020 💰 Profit to Date: $13,549.65
 * data from Google Ads
I run a few popular websites where I collect advertising revenue via Google Ads (formerly Google AdSense). I also collect revenue via direct partnerships with advertisers & from affiliate links, but for times sake, I'm going to omit those deals.
I won't be doing month-to-month write ups here because I don't spend much time maintaining these websites. They started out as passion projects that allowed me to become a better web developer, but today I spend very little time working on them.
Here's a glimpse into my Google Analytics for my website:
* click to expand
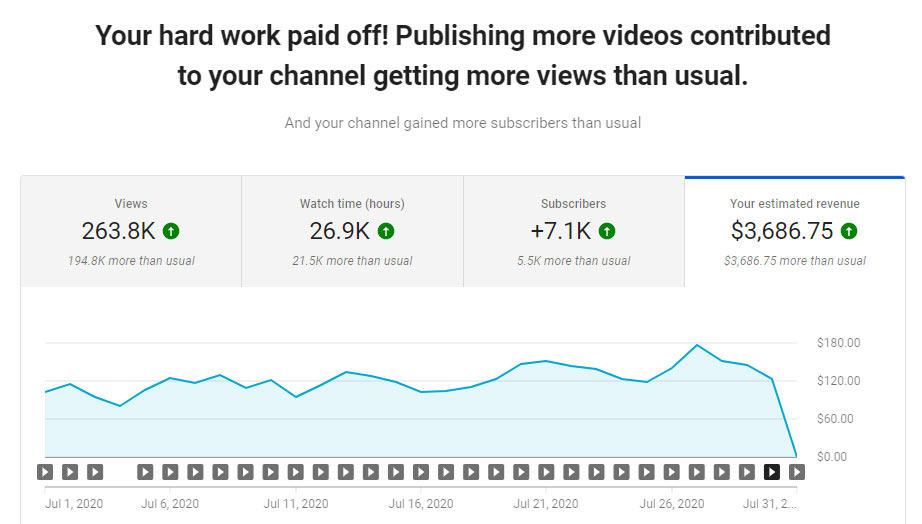
YouTube Revenue
My YouTube channel (Ryan Hogue Passive Income) monetizes most videos that get posted.
As a result, I see a bit of additional income each month from Google running video (AdSense) ads.
Earnings: $3,686.75
* click to expand
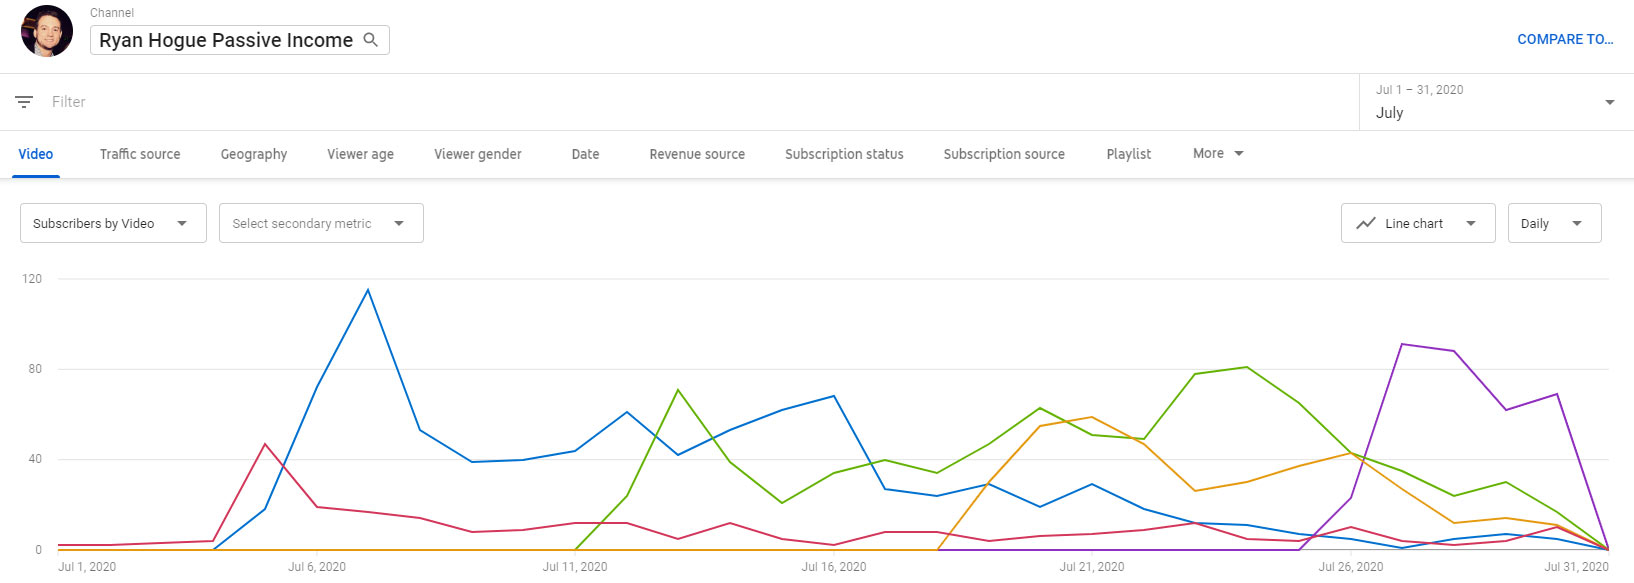
Subscribers: +7,100
* click to expand
If you haven't already, click the link below & subscribe to receive updates when I post new content!