February is the shortest month of the year meaning less days to make sales. Lets see if that effected my bottom line on Amazon FBA, Merch, KDP, & Print on Demand.
Sales: 1,760
Revenue: $33,871.70
Profit: $5,493.21
Gross Margin: 16%
2020 💰 Profit to Date: $10,847.56
 * sales data from JungleScout Sales Alaytics
February is a short month, but because this year is divisible by 4 & we follow the Gregorian calendar, we got an additional day of sales.
(I wont lie, I woke up surprised to see that it was February 29th on Saturday)
Here are my most profitable SKUs in February:

* click to expand
One new-ish seller in the niche that I've been consistently dominating has been making my life tougher lately.
He's been pricing his products quite low, running coupons 24/7, and breaking the Amazon TOS about primary thumbnails to make his listings more attractive in the SERP.
Which means that I've had to:
- Lower my prices to be competitive
- Run coupons
- Consider (I have NOT done this... yet) breaking the TOS to add similar "enhancements" to my primary thumbnails
The reality is, customers shop with their eyes.
If you add product data that you know customers are looking for to the thumbnails, it will absolutely increase their click-through rate (CTR) & likely result in additional sales.
I hate the idea of potentially putting my Amazon account at risk by breaking TOS but I also don't know what the penalty would be for doing so.
The reality is Amazon's catalog is absolutely massive & policing it with some algorithmic detection of thumbnails that break the rules would be incredibly hard.
I imagine the proposition is low risk / medium reward.
It's just tough seeing someone enter my niche & achieve success as a result of being bold enough to accept risk & break rules.
And here's my Campaign Manager statistics from Seller Central:

- Spend: $1,230.86 $273.27 MoM
- Sales: $2,981.20 $1,026.27 MoM
- ACos: 41.29% 3.76% MoM
I need to make note of something weird...
I've been actively monitoring my campaigns & using the "apply recommended bids" to keywords that are seeing impressions (& clicks) across the board on all of my SKUs.
While my ACoS is not great, it's also not a cause for alarm in my book because my costs have been going down.
When I looked today, I saw primary keywords for some niches that used to cost as high as $5.00 per click being suggested @ less than $2.00 per click (for EXACT match!).
It was not isolated to just that niche.
Other niches that I sell products in also saw a similar trend in reduction of PPC bid costs.
If I can find out why, I'll let you all know. Until then, I recommedn just going in & checking your PPC bids and reducing them if you're coming in above the recommended (unless you're trying to suppress your competition & dominate sponsored views).
If you're ready to start your FBA business, you can enroll below:

I show you exactly how I built my FBA business from the ground up, & how I run it today - nothing is held back.
Sales: 342
Revenue: $6,215.92
Royalty: $985.45
Avg. Royalty: $2.88
2020 💰 Profit to Date: $1,856.14
 USA
USA
$960.86 UK
UK
£12.05 DE
DE
€8.29
 * sales data from PrettyMerch Pro
I saw a nice resurgence in my Merch sales in February, which was not expected, but definitely appreciated.
Some "Merch conspiracy theorists" may attribute the increase to the fact that I uploaded almost daily throughout the month (upload numbers to come later).
Ultimately, I finished just under the $1,000 mark on $6,215.92 of sales on the month.
My UK & DE sales have not been great, but I also only uploaded about 1/3rd of my pre-2019 catalog there to test the waters.
(I've been using automation to help scale out bulk designs since then)
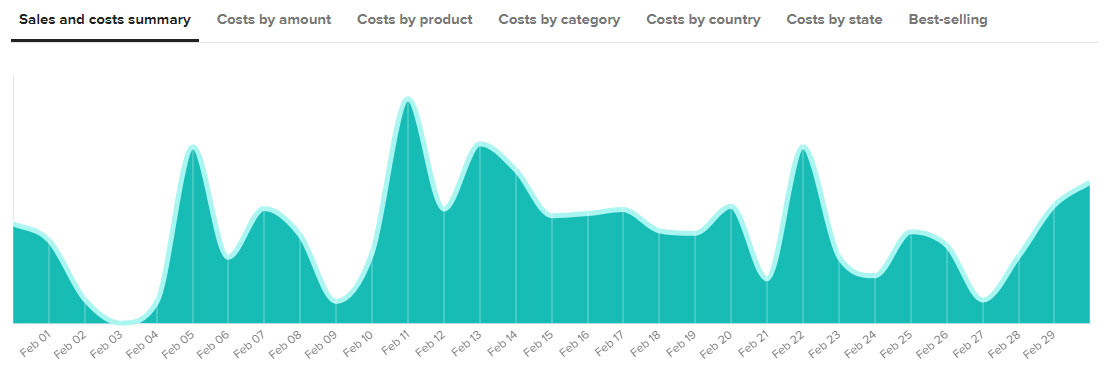
Here's my sales breakdown by day:

* click to expand
Breakdown by product type:

* click to expand
Breakdown by fit type:

* click to expand
And last, breakdown by color:

* click to expand
Uploads Update
17,309 / 20,000

I cracked the 17,000 mark and have about 3,000 uploads to go before maxing out my 20,000 upload slots.
I've got some big news coming soon about how I've been able to create high quality designs for upload with minimal effort - stay tuned!
If you're ready to take your Amazon Merch business to the next level, you can enroll in Ryan's Method: Amazon Merch Course below:
I show you every trick in the book that I used to reach tier 10,000, including niche research tips, design tips, listing optimization tips, AMS advertising tips, & automation tips in the bonus section!
Sales: 237
Profit: $1,258.48
2020 💰 Profit to Date: $2,810.12
- Amazon.com
134 - Amazon.co.uk
12 - eBay
3 - Etsy
0 - Redbubble
58 - Spreadshirt
9 - Teepublic
20 - Teespring
0 - Zazzle
1
It wasn't a particularly great month, and I still pocketed $1,258... which is a testament to why it pays to diversify your offerings on multiple platforms.
Amazon (predictably) lead the way as it gets the most traffic.
By the way - I should mention that I didn't run any paid ads to generate these sales. This is purely from organic visibility.
Update on the POD Hijacker
I had a few friends do test orders on his products... and to my surprise, it looks like the guy is using Printful to fulfill his orders!
The products + packaging looks identical.
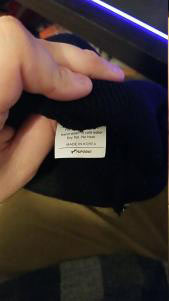
* click to expand
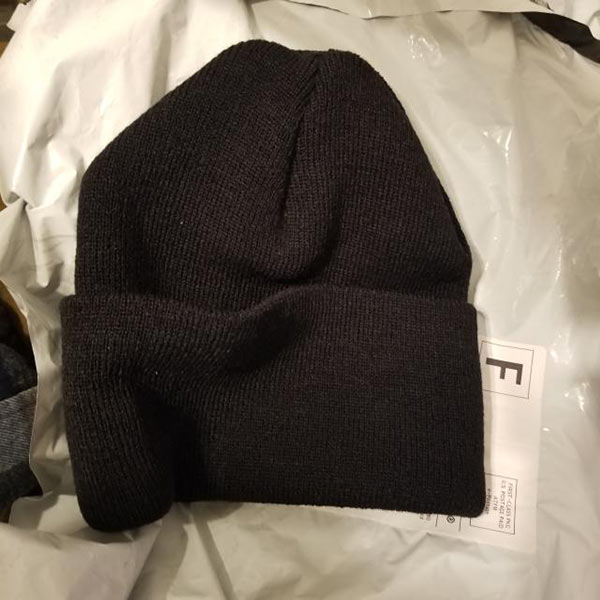
* click to expand
* click to expand
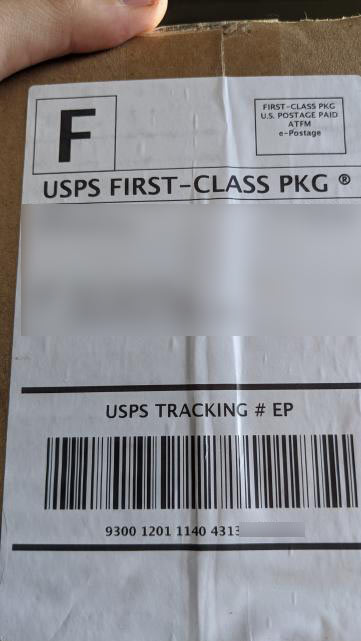
But then I looked closer and realized the return address was different... and traced it to this business based in NYC that does custom embroidery:
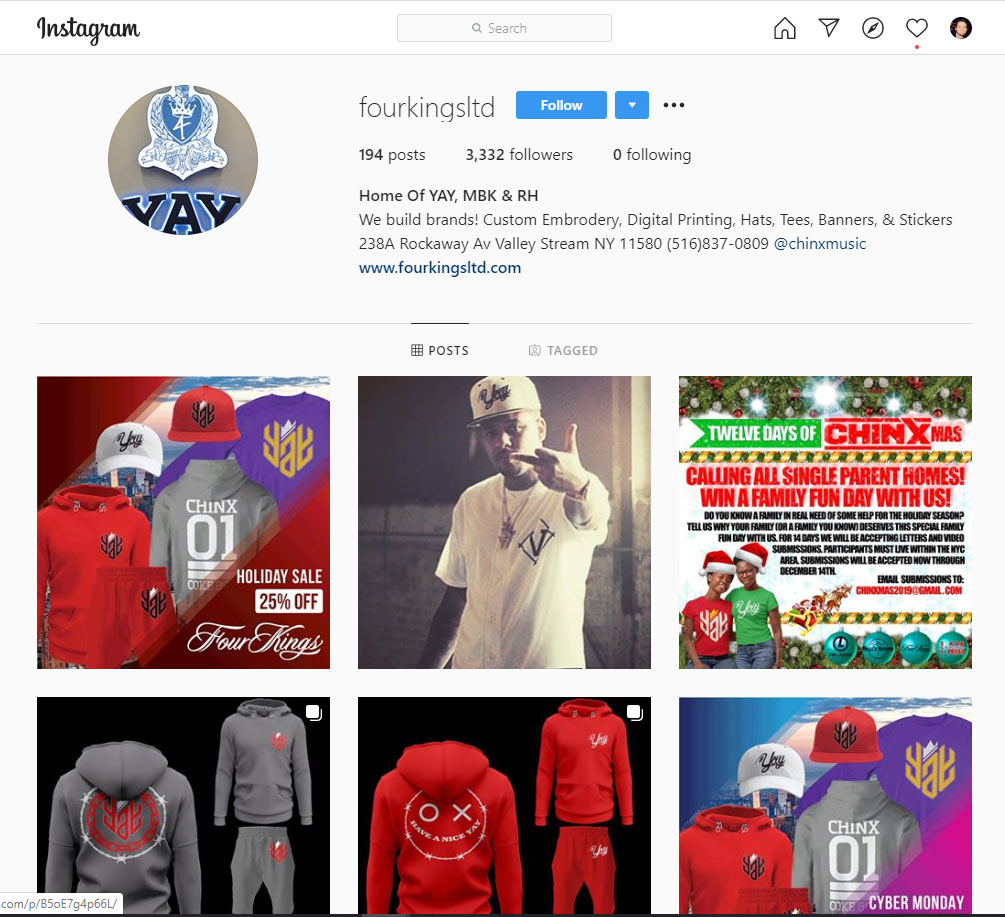
* click to expand
So basically, it looks like I'm being undercut by this NYC based apparel company.
89 listings are currently being undercut
* Ugh *
And if you're wondering just how much damage they are potentially doing to my sales, here are some of the BSRs of the producst they've undercut me on:
- BSR #1: 184,329
- BSR #2: 888,268
- BSR #3: 916,933
- BSR #4: 408,692
- BSR #5: 939,165
- BSR #6: 881,695
- BSR #7: 629,237
- BSR #8: 847,730
Not fun, but I'll continue working in what little spare time I have at finding a resolution...
Here's my Printful sales chart for my Amazon (.com) Seller Central account:
* click to expand
I was fortunate to see a massive spike in sales on a trending hat in January, but this month I had no major trending designs.
Sometimes you get lucky, other times you rely on your evergreens + new designs.
Here's a breakdown of my profit from my top 4 platforms:
- Amazon (.com): $805.68
- Redbubble: $157.72
- Amazon (.co.uk): $156.48
- Teepublic: $54.75
I've been continuing to upload 50 designs per day to 8 (or more) different marketplaces.
For information on how to use automation to easily upload to different destinations & how to grow your print on demand business, check out my Dropshipped POD course:
Enrollment in Ryan's Method: Dropshipped Print on Demand is OPEN!
In it, I walk you through setting up your Amazon Seller Central account & integrating it with Printful + opening an optimized Etsy shop & cover selling on ~7 other platforms, to maximize coverage & get the highest return on investment from each print on demand design you create.
Sales: 170
Profit: $322.32
Avg. Royalty: $1.90
2020 💰 Profit to Date: $834.50

$322.32 of profit was generated on 170 sales @ an average royalty of $1.90 per paperback book.
Unfortunately, KDP has been tinkering with their approval system.
I never want to be caught in the net during a change, so I only uploaded around ~100 book in February.
When there are big changes, I don't mind spectating from the sideline in order to keep my account safe.
It looks like we may have to break away from uploading the same low-content notebook interiors and move towards more niche content, at least in the short term, to get past the approval algorithm.
Profit breakdown by market:

* click to expand
Here's a breakdown of my profits by Amazon marketplace:
- United States: $265.37
- United Kingdom: $46.86
- Spain: $3.81
- Canada: $3.65
- Japan: $2.63
Sales breakdown by day for February:

* click to expand
Sales breakdown by market:

* click to expand
If you'd like me to show you how to sell low content books on Amazon on AUTOPILOT while having Amazon fulfill the orders + customer service for you, you're in luck:
Enrollment in Ryan's Method: Amazon KDP is OPEN!
By selling "low content" books, we avoid spending time writing the content for book interiors & instead focus on selling notebook-style paperback books to various niche markets. Trust me - it works!
Google Ads
Earnings (Total): $1,107.26
YouTube: $767.87
Website: $339.39
Page Views: 572,928
Ad Impressions: 1,174,449
2020 💰 Profit to Date: $650.10
 * data from Google Ads
I run a few popular websites where I collect advertising revenue via Google Ads (formerly Google AdSense). I also collect revenue via direct partnerships with advertisers & from affiliate links, but for times sake, I'm going to omit those deals.
I won't be doing month-to-month write ups here because I don't spend much time maintaining these websites. They started out as passion projects that allowed me to become a better web developer, but today I spend very little time working on them.
Here's a glimpse into my Google Analytics for my website:
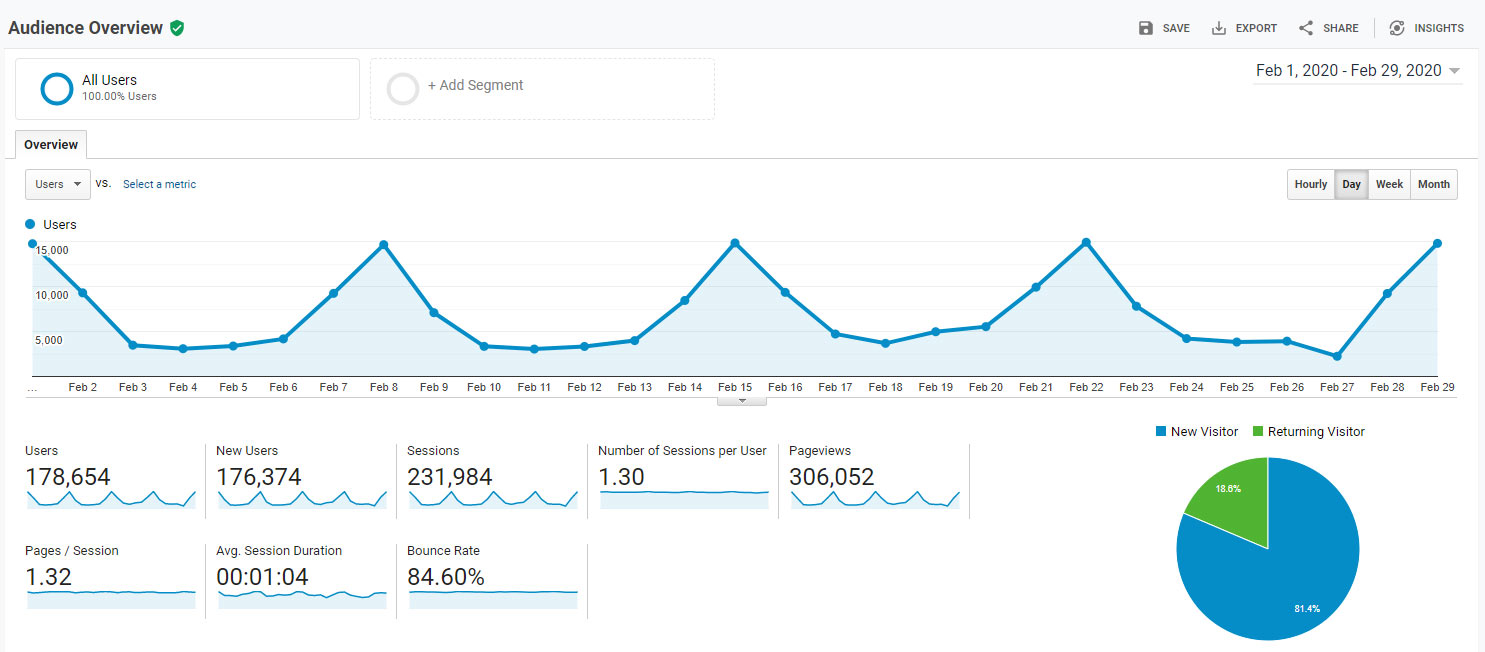
* click to expand
YouTube Revenue
My YouTube channel (Ryan Hogue Passive Income) monetizes most videos that get posted.
As a result, I see a bit of additional income each month from Google running video (AdSense) ads.
Earnings: $767.87
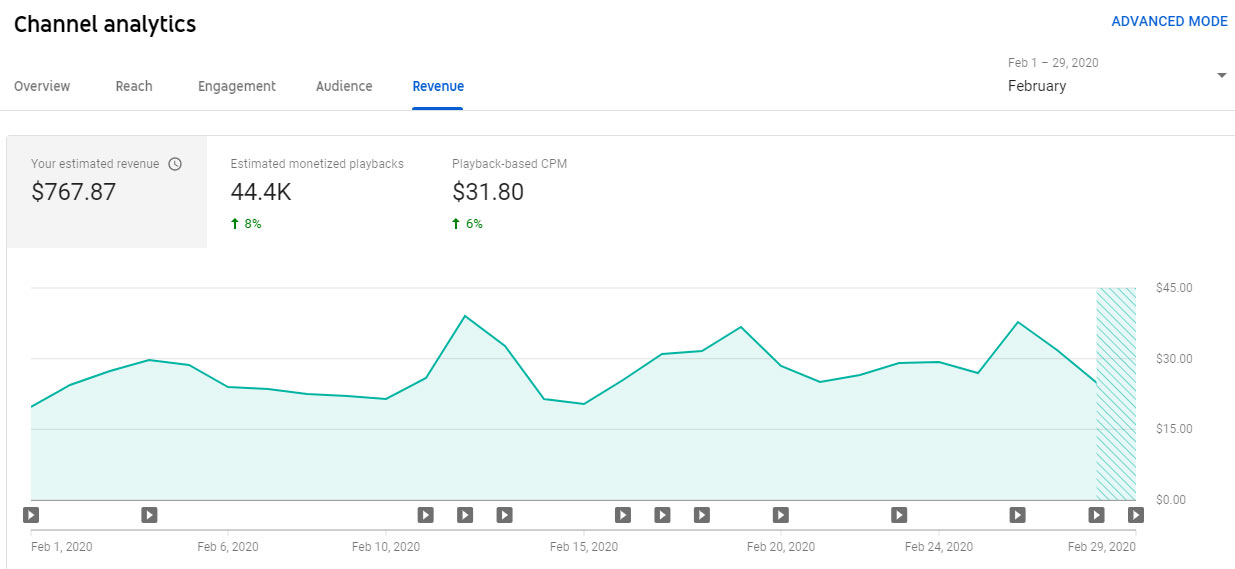
* click to expand
Subscribers: 1,460
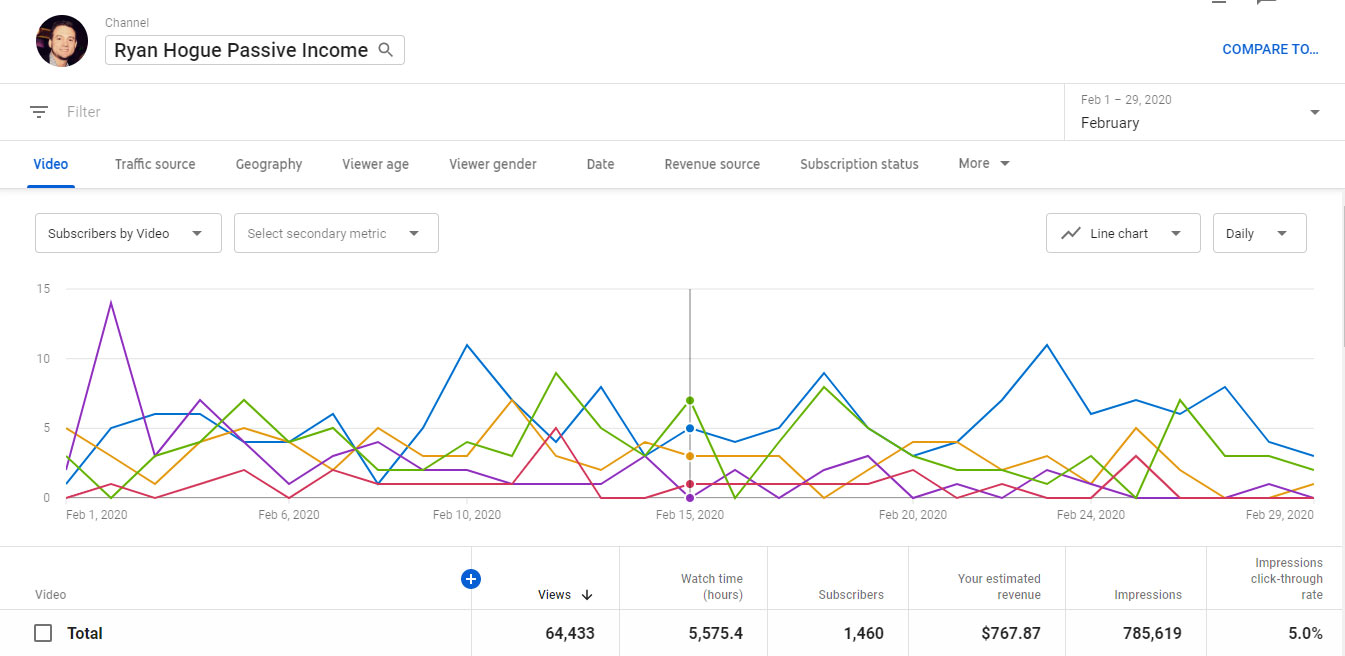
* click to expand
If you haven't already, click the link below & subscribe to receive updates when I post new content!